Something I've noticed for a long time played out yet again the other day...
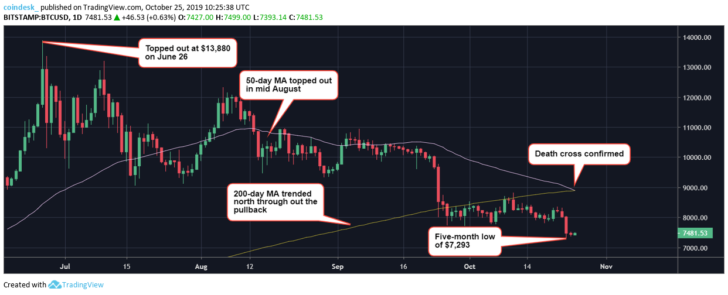
Early Friday morning (October 25th) an important technical pattern triggered on bitcoin.
A pattern known as a "Death Cross".
It has an ominous name and is often quoted by traders as an extremely bearish technical indicator/pattern.
Specifically, it is where a faster moving average, usually the 50 period MA, crosses below a slower moving average, usually the 200 period MA.
It triggered early Friday morning on bitcoin:

(Source: https://www.coindesk.com/bitcoin-charts-death-cross-after-47-price-drop-from-2019-high)
What happened next?
Well, unless you have been living under a rock the last couple days, you know very well what happened next.
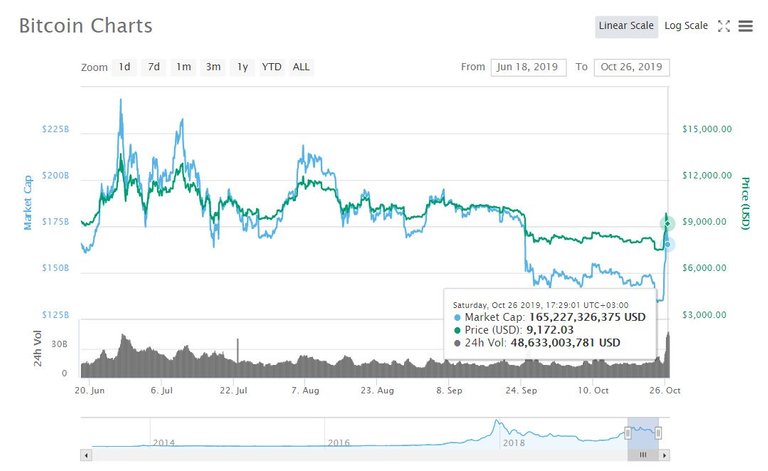
Bitcoin spiked some 40% in a 24 hour period!
Briefly touching highs over $10,500 per coin after being below $7,400 just a day before.
Not only that, but bitcoin saw record breaking volume in the process:

(Source:
Bitcoin saw $48.6 billion in dollar volume on October 26th, which was a new all time high since bitcoin was created over a decade ago.
The previous all time high was $46.4 billion on June 27th earlier this year.
And this started on a very day that this supposedly extremely bearish technical pattern triggered.
A bearish pattern you say?
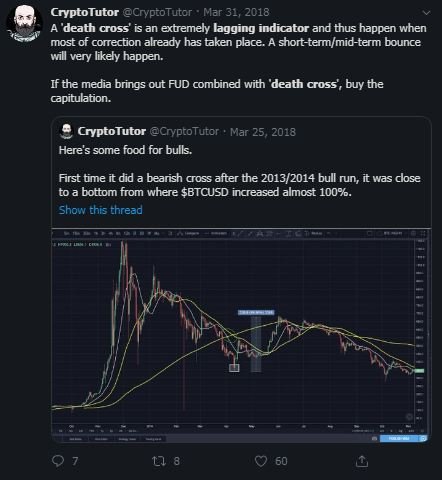
I have noticed throughout my years of trading that the Death Cross is so much of a lagging indicator and it happens after an asset is already so beat up, that it often signals a short term bottom at the very least.
And possibly an outright entire trend reversal.
In fact, I am not the only one that has noticed that.
Check this out:

(Source: https://www.coindesk.com/bitcoin-charts-death-cross-after-47-price-drop-from-2019-high)
The same thing likely happened here.
We had sentiment at such extremes that it didn't take much pushing in the other direction to get a massive snap back rally, right at the time when things were starting to looking their most bearish.
Stay informed my friends.
-Doc


